Revised: 31 January 2018
Medicines
Medsafe’s performance in the evaluation of new and changed medicines during 2017
Total number of applications received - 1 January to 31 December 2017
| Application type | Received |
|---|---|
| Higher risk medicine | 41 (46% abbreviated) |
| Intermediate risk medicine | 65 (68% abbreviated) |
| Lower risk medicine | 55 |
| Changed medicine | 1249 |
| Priority assessment | 10 |
Total number of applications granted consent - 1 January to 31 December 2017
| Application type | Consented |
|---|---|
| Higher risk medicine | 48 |
| Intermediate risk medicine | 51 |
| Lower risk medicine | 44 |
| Changed medicine | 1241 |
Section 24(5) Referrals - 1 January to 31 December 2016
| Referred | 64 (5%) |
|---|---|
| Consented | 58 |
The number of applications received is different to the number of consents
granted because the approval process may be longer than 12 months. Applications
consented in any given year typically include a proportion lodged in preceding
years.
Recorded performance
Key Performance Indicators
- 88% of new medicine applications had an initial assessment completed within 200 calendar days
- 99.7% of changed medicine notifications were responded to within 45 calendar days
Target Processing Times
Number of administrative events completed within Medsafe's target processing times (in calendar days).
| Application Type/Event | Initial evaluation | 1st Request for information | Evaluation of 1st response | 2nd Request for information | Evaluation of 2nd response |
|---|---|---|---|---|---|
| Higher risk medicine application (full evaluation) | 50% (13 of 26) within 200 days 80% within 222 days |
97% within 200 days | 37% within 120 days | 81% within 120 days | 47% within 120 days |
| Higher risk medicine application (abbreviated evaluation) | 33% (9 of 27) within 100 days 90% within 190 days |
||||
| Intermediate risk medicine application (full evaluation) | 70% (19 of 27) within 200 days 80% within 219 days |
85% within 200 days | 33% within 120 days | 89% within 120 days | 48% within 120 days |
| Intermediate risk medicine application (abbreviated evaluation) | 63% (32 of 51) within 100 days 90% within 139 days |
||||
| Lower risk medicine application | 100% (51 of 51) within 200 days | 92% within 200 days | 100% within 120 days | 96% within 120 days | 71% within 120 days |
| Initial evaluation | Requests for information | Evaluation of responses | |
|---|---|---|---|
| Changed medicine notifications | 80% (1045 of 1300) within 21 days | 50% within 21 days | 71% within 21 days |
Lower risk medicine applications submitted
| Application type/Event | Initial evaluation | 1st Request for information | Evaluation of 1st response | 2nd Request for information | Evaluation of 2nd response |
|---|---|---|---|---|---|
| N1 15% of applications |
50% (7 of 14) within 30 days 80% within 60 days |
60% within 7 days | 25% within 7 days 80% within 14 days |
17% within 7 days | 83% within 21 days 100% within 27 days |
| N3 56% of applications |
42% (10 of 24) within 60 days 80% within 105 days |
11% within 30 days | 50% within 30 days 80% within 101 days |
65% within 30 days | 70% within 30 days 80% within 35 days |
| N4 5% of applications |
50% (4 of 8) within 90 days 80% within 99 days |
0% within 30 days | 0% within 30 days 100% within 55 days |
0% within 30 days | 0% within 30 days 100% within 41 days |
| N5 24% of applications |
40% (2 of 5) within 120 days 80% within 191 days |
17% within 60 days | 50% within 60 days 100% within 70 days |
33% within 60 days | 0% within 60 days 80% within 184 days |
Total time to conclude prescription medicine applications (2017)
The following table represents the total time to conclude the stated proportion of applications in calendar days. Total time is calculated from the date of payment to the completion of evaluation and includes the time taken by the applicant to respond to any requests for information.
| Proportion of applications concluded within specified time in calendar days | ||||
|---|---|---|---|---|
| Application Type | Mean | 70% | 80% | 90% |
| Higher risk medicine via full evaluation | 503 | 757 | 813 | 837 |
| Higher risk medicine via abbreviated evaluation | 411 | 397 | 403 | 604 |
| Intermediate risk medicine via full evaluation | 711 | 851 | 966 | 991 |
| Intermediate risk medicine via abbreviated evaluation | 478 | 528 | 556 | 765 |
| Priority assessment via full evaluation | 132 | 161 | 194 | 194 |
| Priority assessment via abbreviated evaluation | 225 | 225 | 225 | 225 |
Regulator time taken to conclude applications (2017)
The following table represents the number of calendar days that Medsafe spent on evaluating various application types.
| Proportion of applications concluded within specified time in regulator calendar days | |||
|---|---|---|---|
| Application Type | Mean | 80% | 90% |
| Higher risk medicine via full evaluation | 342 | 419 | 488 |
| Higher risk medicine via abbreviated evaluation | 307 | 331 | 426 |
| Intermediate risk medicine via full evaluation | 516 | 678 | 698 |
| Intermediate risk medicine via abbreviated evaluation | 342 | 419 | 488 |
| Priority assessment via full evaluation | 114 | 165 | 165 |
| Priority assessment via abbreviated evaluation | 197 | 197 | 197 |
Total time to conclude lower risk (OTC) medicine applications submitted (2017)
The following table represents the total time to conclude the stated proportion of applications in calendar days.
Total time is calculated from the date of payment to the completion of evaluation and includes the time taken by the applicant to respond to any requests for information.
| Proportion of applications concluded within specified time in calendar days | ||||
|---|---|---|---|---|
| Application Type | Mean | 70% | 80% | 90% |
| N1 | 193 | 225 | 269 | 95 |
| N3 | 390 | 422 | 532 | 574 |
| N4 | 318 | 318 | 318 | 318 |
| N5 | 714 | 793 | 793 | 896 |
Number of applications received during the previous five years
| Application type | 2013 | 2014 | 2015 | 2016 | 2017 |
|---|---|---|---|---|---|
| Higher risk medicine | 49 (57% abbreviated) | 56 (70% abbreviated) | 60 (60% abbreviated) | 48 (50% abbreviated) | 41 (46% abbreviated) |
| Intermediate risk medicine | 109 (62% abbreviated) | 83 (60% abbreviated) | 75 (50% abbreviated) | 73 (70% abbreviated) | 65 (68% abbreviated) |
| Lower risk medicine | 63 | 58 | 50 | 23 | 55 |
| Changed medicine | 1369 | 1525 | 1415 | 1392 | 1249 |
| Priority assessment | 4 | 12 | 10 | 8 | 10 |
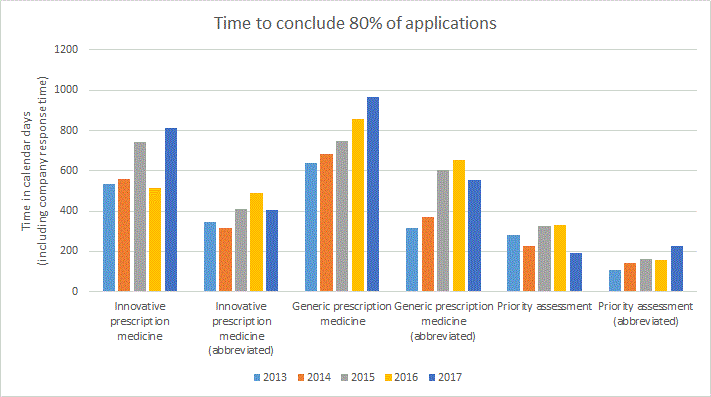
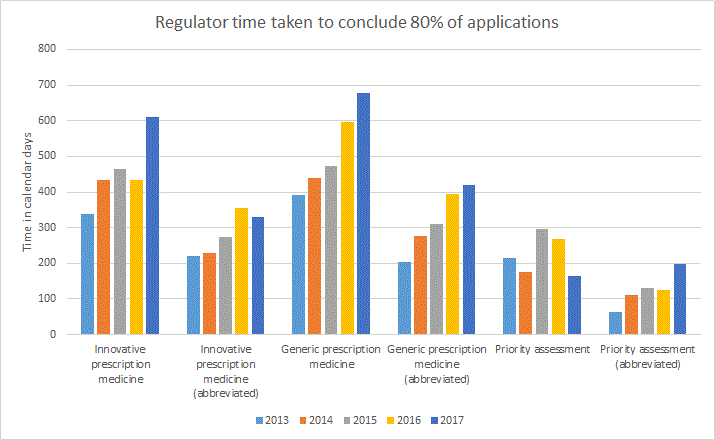
Comparison of the total time to conclude prescription medicine applications during the previous five years
The following graph represents the total time to conclude the stated proportion of applications in calendar days inclusive of applicant response time.

The following graph represents the regulator time to conclude the stated proportion of applications in calendar days exclusive of applicant response time.

Performance against evaluation timeframes 2016
Performance against evaluation timeframes 2015
Performance against evaluation timeframes 2014
Performance against evaluation timeframes 2013


